Open data - Download the Knowledge base
You are free to download the data of this Knowledge base.
To do this you must be an authenticated user: log in or sign in now.
All the data are licensed as Creative Common CC-BY 4.0.
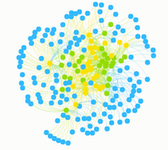
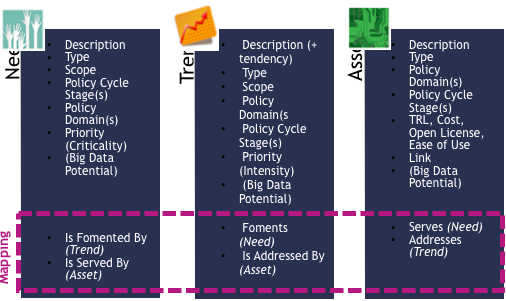
The Big Policy Canvas Knowledge Base is a state-of-the-art, online and dynamic repository that functions as an accumulator uniting all the knowledge produced during the project. It is structured along the three dimensions of needs, trends and assets and furthermore offers a mapping among them by defining how they are interconnected and how they influence each other.
Are you aware of an asset that can help enrich the BPC KB? Share it with us and be named contributors to our work.
The Big Policy Canvas Knowledge Base is a state-of-the-art, online and dynamic repository that functions as an accumulator uniting all the knowledge produced during the project. It is structured along the three dimensions of needs, trends and assets and furthermore offers a mapping among them by defining how they are interconnected and how they influence each other.
Accordingly, the Knowledge Base comprises all current and emerging needs and trends as well as the technological and methodological assets serving and addressing them respectively. Every element identified in the three dimensions is defined according to its type, scope, priority, and the policy domains and policy cycle stages in which it applies. A list of criteria, namely namely the type of need, trend or asset, the priority, the Big data potential, as well as the type of item itself enable the user to filter and navigate through the Knowledge Base contents.
The Knowledge Base targets to support the uptake and reuse of solutions that hold the potential to advance policy making processes, leading towards next-generation policy making.
Read the article about the Knowledge Base in the blog and know more about how we have identified and analysed the trends and how we have assessed the Big Data Potential.
Datawrapper is an online data-visualisation tool for making interactive charts. Once the user uploads the data from CSV/PDF/Excel file or pastes it directly into the field, Datawrapper generates a bar, line, map or any other related visualisation. Datawrapper graphs can be embedded into any website or CMS with ready-to-use embed codes
Orange enables open source data visualisation and data analysis for novice and expert. It provides a large toolbox to create interactive workflows to analyse and visualise data. Orange is packed with different visualisations, from scatter plots, bar charts, trees, to dendrograms, networks and heat maps
Qlik enables to create visualisations, dashboards, and apps that answer a company’s most important questions
Tableau democratises visualisation in an elegantly simple and intuitive tool. It is exceptionally powerful in business because it communicates insights through data visualisation. In the analytics process, Tableau’s visuals allow to quickly investigate a hypothesis, sanity check the latter, and just go explore the data before embarking on a treacherous statistical journey
Semantria is a tool that offers a unique service approach by gathering texts, tweets, and other comments from clients and analysing them meticulously to derive actionable and highly valuable insights. Semantria offers text analysis via API and Excel plugin, incorporates a big knowledge base and uses deep learning
Infogram offers over 35 interactive charts and more than 500 maps to help visualise data beautifully. It enables users to create a variety of charts including column, bar, pie, or word cloud or even add a map to their infographics or reports to impress their audience
The City of Adelaide has created a digital 3D City Model that is helping visualise the City’s future, particularly in relation to growth scenarios and land use planning
Nowcasting is a forecasting methodology that is becoming increasingly popular in economics. The use case considers the potential use of Νowcasting in the context of economic policy setting and sets the potential value of an extended use of Νowcasting against different contexts.
This use case covers the methods that can assist policymakers throughout all stages of the policy cycle. It explains the sources for these data and how the outputs can be used to gain. understanding of stakeholders’ and citizen’s opinions on policies and strategies
You are free to download the data of this Knowledge base.
To do this you must be an authenticated user: log in or sign in now.
All the data are licensed as Creative Common CC-BY 4.0.


This website reflects the views only of the Consortium, and the Commission cannot be held responsible for any use which may be made of the information contained herein. The editorial content of this site is distributed under a Creative Commons License, Attribution-ShareAlike 4.0 International (CC BY-SA 4.0) except where otherwise specified.