Open data - Download the Knowledge base
You are free to download the data of this Knowledge base.
To do this you must be an authenticated user: log in or sign in now.
All the data are licensed as Creative Common CC-BY 4.0.
The Big Policy Canvas Knowledge Base is a state-of-the-art, online and dynamic repository that functions as an accumulator uniting all the knowledge produced during the project. It is structured along the three dimensions of needs, trends and assets and furthermore offers a mapping among them by defining how they are interconnected and how they influence each other.
Are you aware of an asset that can help enrich the BPC KB? Share it with us and be named contributors to our work.
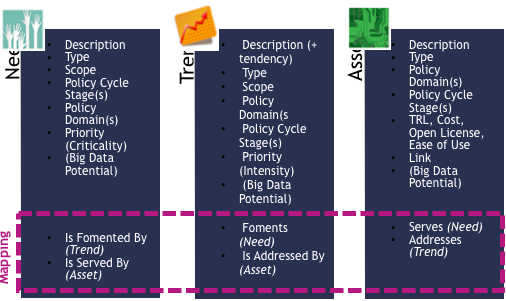
The Big Policy Canvas Knowledge Base is a state-of-the-art, online and dynamic repository that functions as an accumulator uniting all the knowledge produced during the project. It is structured along the three dimensions of needs, trends and assets and furthermore offers a mapping among them by defining how they are interconnected and how they influence each other.
Accordingly, the Knowledge Base comprises all current and emerging needs and trends as well as the technological and methodological assets serving and addressing them respectively. Every element identified in the three dimensions is defined according to its type, scope, priority, and the policy domains and policy cycle stages in which it applies. A list of criteria, namely namely the type of need, trend or asset, the priority, the Big data potential, as well as the type of item itself enable the user to filter and navigate through the Knowledge Base contents.
The Knowledge Base targets to support the uptake and reuse of solutions that hold the potential to advance policy making processes, leading towards next-generation policy making.
Read the article about the Knowledge Base in the blog and know more about how we have identified and analysed the trends and how we have assessed the Big Data Potential.
Splash is a research project aimed at building a framework that supports the integration of multiple existing models, simulations, and data that represent parts of the broader health ecosystem. Specifically, the goal is to create a platform that takes expert models of constituent real-world systems related to health, synthesising and integrating those models, resulting in an interoperating complex composite system model with which policy-makers can try out alternatives in a low-cost, highly responsive way.
Business process re-engineering (BPR) is a business management strategy, originally pioneered in the early 1990s, focusing on the analysis and design of workflows and business processes within an organization. BPR aimed to help organizations fundamentally rethink how they do their work in order to dramatically improve customer service, cut operational costs, and become world-class competitors.
This case focuses on the opportunity that micro - data on learning processes (e.g. within universities) and the use of learning analytics provide for the design of educational strategies by policy makers at a national and European level
The Big Data Value Association advertises and grants the “BDVA i-Space”-label for European Innovation Spaces to help drive forward Big Data adoption across all domains within European industry. Hubs can be granted with the label in the three grades Bronze, Silver and Gold within the following five domains: Excellence of infrastructure, Quality of Services, Projects and sectors, Impact to Eco System and Business model.
ISO 19731:2017 specifies the terms and definitions, as well as the service requirements, for organizations and professionals such as service providers who conduct digital analytics and web analyses for collecting, analysing and reporting of digital data for purposes of market, opinion and social research.
An App, which collects data and shows weather related information (e.g. duration of rain showers) but also predicts the weather in the Netherlands
The analysis is powered by a hybrid Natural Language Processing (NLP) engine that runs highly sophisticated linguistic algorithms and Machine Learning classifiers. The engine is wrapped in a platform-agnostic REST API service that enables your software applications, workflows, and services to receive rich TheySay JSON metadata with minimal integration work
Google Fusion tables is a web application for data analysis, large data-set visualisation, and mapping. It allows users to easily create data visuals and publish them online instantly with provided subsets and an easy format similar to online files. It further supports the ability to work through larger data sets including filtering, sorting, summarising them in collaboration with other users online. It enables users to share and combine multiple tables between users and publicly available data and merge them into one. The application is still experimental and its API has released V2
Opinion Crawl is an online sentiment analysis for current events, companies, products, and people. Opinion Crawl allows visitors assess Web sentiment on a topic – a person, an event, a company or a product. The user can enter a topic and get an ad-hoc sentiment assessment of it. For each topic, the user gets a pie chart showing current real-time sentiment, a list of the latest news headlines, a few thumbnail images, and a tag cloud of key semantic concepts that the public associates with the subject.
Cool Farm Tool water metrics enable farmers quickly and easily account for their crops’ water needs and gain insight into better practice.
The tool combines just user inputs with global data sets for crop, soil and climate data, to provide crop water estimates.
You are free to download the data of this Knowledge base.
To do this you must be an authenticated user: log in or sign in now.
All the data are licensed as Creative Common CC-BY 4.0.


This website reflects the views only of the Consortium, and the Commission cannot be held responsible for any use which may be made of the information contained herein. The editorial content of this site is distributed under a Creative Commons License, Attribution-ShareAlike 4.0 International (CC BY-SA 4.0) except where otherwise specified.