The Big Policy Canvas Needs and Trends Assessment Framework
The Big Policy Canvas Needs and Trends Assessment Framework is essentially a methodology for mapping needs and trends to application domains, as well as for assessing the former in terms of their cost, importance, urgency and capability for innovation.
The framework builds upon the concept of the policy cycle and the individual stages that the former incorporates [1], as well as upon an assortment of specific and representative policy domains [2] in the sense that it places application domains, and thereby potential areas for intervention, at the intersection of policy cycle stages with policy domains.
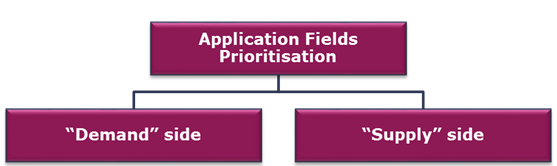
Along the above lines, the framework’s rationale, i.e. the rationale for the prioritisation of application domains, lies in comparing for each application domain Demand and Supply;
- with Demand on the one hand being reflected in the number of needs in each application domain and their criticality, as well as in the number of trends and their intensity;
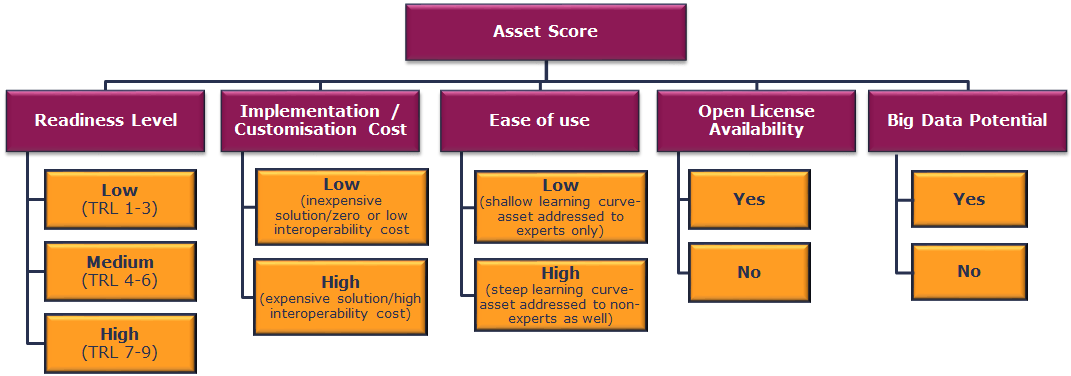
- and Supply being accordingly reflected in the number of assets available in the same application domain and their score, a metric calculated based on specific criteria, those of Technology Readiness Level (TRL), Implementation or Customisation Cost, Ease of Use, Availability of an Open License and Big Data Potential.
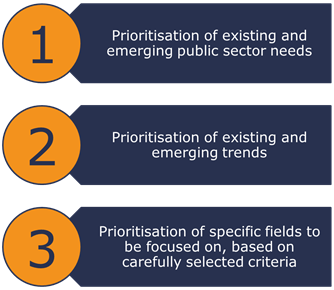
Going into more detail, the Big Policy Canvas Assessment Framework is structured across the following three axes:
- the assessment and prioritisation of existing and emerging needs of public administrations,
- the assessment and prioritisation accordingly of existing and emerging trends that may impact the policy making process and
- the prioritisation of specific application fields based on selected criteria.
Axes I and II deal with the assessment of the “Demand” side, whereas Axis III presupposes the assessment of the “Supply” side and targets the identification of areas for intervention. The rationale for the assessment of both “Demand” and “Supply” lies in mapping needs, trends and assets against application domains, i.e., as stated above, combinations of policy cycle stages and policy domains with the help of the matrix structure shown below:
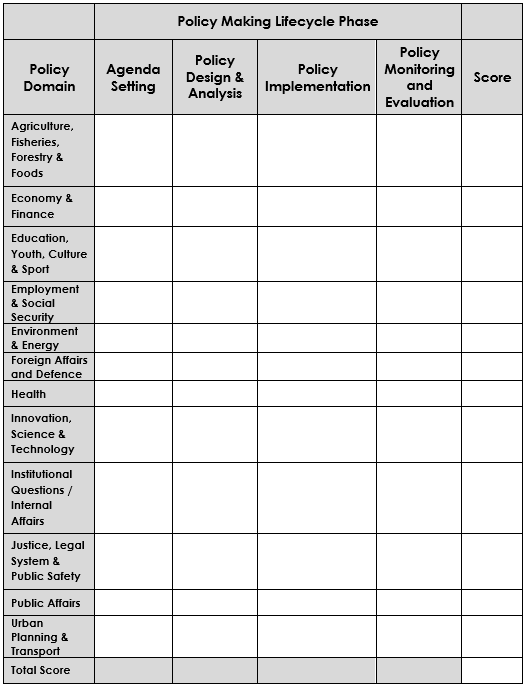
In case of Axes I and II, the latter is filled in for each need or trend, which is mapped to the application domains, on the basis of i. the results of interviews with policy makers, ii. the outcomes of a set of online surveys, designed by the project consortium for this purpose, as well as iii. the findings of the literature review, conducted in the context of the needs’ and trends’ identification. It is worth noting that such mapping may involve as well a qualitative indication of the relevance of each need or trend to policy domains on a five-level scale. Provided that different weights are further attributed to policy cycle stages, the score of each need/trend can be eventually calculated by multiplying its relevance to a specific policy domain by the weight of each policy phase, summing up the products for each row of the assessment matrix and then calculating the sum for all rows. The prioritisation of either needs or trends can then be realised by defining the appropriate score intervals and grouping accordingly needs and trends in a set of priority groups, based on their overall score (aka criticality or intensity respectively).
In case of Axis III, which presupposes the mapping of assets against application fields, the prioritisation of the latter derives by assessing and comparing Supply and Demand scores as shown in Equations 1 and 2 respectively.
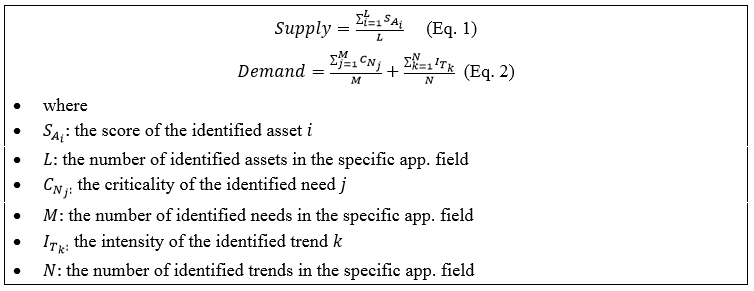
The score of each identified asset, which is required for calculating this ratio accrues by combining the criteria of readiness level, implementation or customisation cost, ease of use, open license availability and big data potential with the help of the Analytic Hierarchy Process (AHP) multi-criteria decision making method (MCDM). The assessment of each of the aforementioned criteria may be supported by appropriate instruments, such as interviews and online surveys, and thus the design of appropriate questionnaires.
The prioritisation of application domains depends heavily on the decision makers’ focus and preferences, and thereby on whether the former place more value on the option of addressing public sector needs and trends impacting the policy-making process as thoroughly as possible or that of taking advantage of readily available assets in the policy making process to produce direct gains.
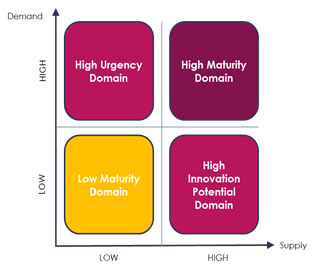
Four different scenarios are recognised, mapping to the four quadrants shaped by different levels of Demand and Supply, as follows:
- Low maturity domain: This scenario corresponds to both a lower level of Demand and a lower level of Supply. An application domain found in this quadrant is characterised by a combination of few and/or low criticality needs and few and/or low intensity trends as well as low availability of assets. Thereby, it makes up an immature field, one of both low urgency and low innovation potential for evidence-based policy making and can be thus classified as a low priority/interest domain.
- High urgency domain: This scenario corresponds to a higher level of Demand combined with a lower level of Supply, namely it is characterised by several and/or high criticality needs and several and/or high intensity trends but a scarcity and/or low suitability at the same time of technological and methodological assets to accommodate them. Mapping an application field to this scenario indicates thereby that the latter is a high interest/priority domain and additionally reveals that further research is needed within its frame to support the development of assets that may cater for the identified needs of public administrations and/or give shape to the identified trends impacting the policy making process.
- High innovation potential domain: This scenario maps accordingly to a lower level of Demand and a higher level of Supply. An application domain located in this quadrant is characterised by an abundance of or highly scoring technological and methodological assets that may be used to serve a limited number of and/or lower criticality needs and to address a limited number of and/or lower intensity trends. Thus, it makes up a high interest/priority domain, the interest on which emanates from the capability to directly benefit from the application of existing assets and innovations.
- High maturity domain: The last scenario is characterised by high levels of both Demand and Supply. Application domains that are located in the upper right part of the comparison diagram involve many and/or high criticality needs as and/or many and/or high intensity trends, whereas they further present an abundance of and/or highly scoring identified assets. Thereby, they come forth as high interest/priority domains, which ignite interest upon them due to the maturity of both the Demand and Supply levels they feature.
Addressed primarily to public administration representatives, policy makers and researchers, the Needs and Trends Assessment Framework is a methodological tool that can be customised as per the needs of the former stakeholders. In particular, application of Framework Axes I and II can be customised by weighting appropriately the different stages of the policy making cycle, as well as by attributing greater importance to specific policy domains, whereas implementation of Axis III can be fine-tuned in the directions of both the assessment criteria themselves as well as their relative importance in the calculation of the assets’ overall score.
[1] Agenda Setting, Policy Design and Analysis, Policy Implementation & Policy Monitoring and Evaluation.
[2] Agriculture, Fisheries, Forestry & Foods, Economy & Finance, Education, Youth, Culture & Sport, Employment & Social Security, Environment & Energy, Foreign Affairs and Defense, Health, Innovation, Science & Technology, Institutional Questions / Internal Affairs, Justice, Legal System & Public Safety, Public Affairs, Urban Planning & Transport.


